Customize
Once you've gotten started, use these simple demos as branching points to extend the system to your use case.
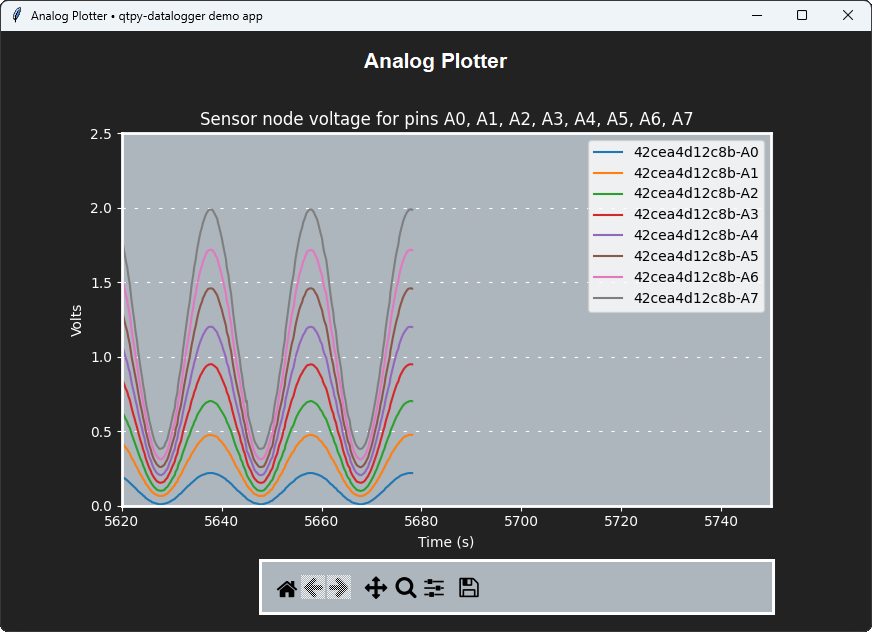
Analog Plotter
A custom host-side app that plots analog data using the built-in sensor node app qtpycmd.
- Analog input
- Network / MQTT
- Serial / UART
- Copy the app's source file
analog_plotter.pyto yourqtpy-previewfolder - Run it with
- Edit the variables at the top of
get_and_plot_data()to exercise the features- Note that this example only enables UART communication to start
- If you setup MQTT to use WiFi, change
use_mqtttoTrue
Full-stack app
Still cooking...
Ready for more?
See Develop and choose:
- Add
qtpy-dataloggerto your project - Or fork-and-branch
Go get logging!